LED photometric curve: how to read the test report
· Guías técnicas
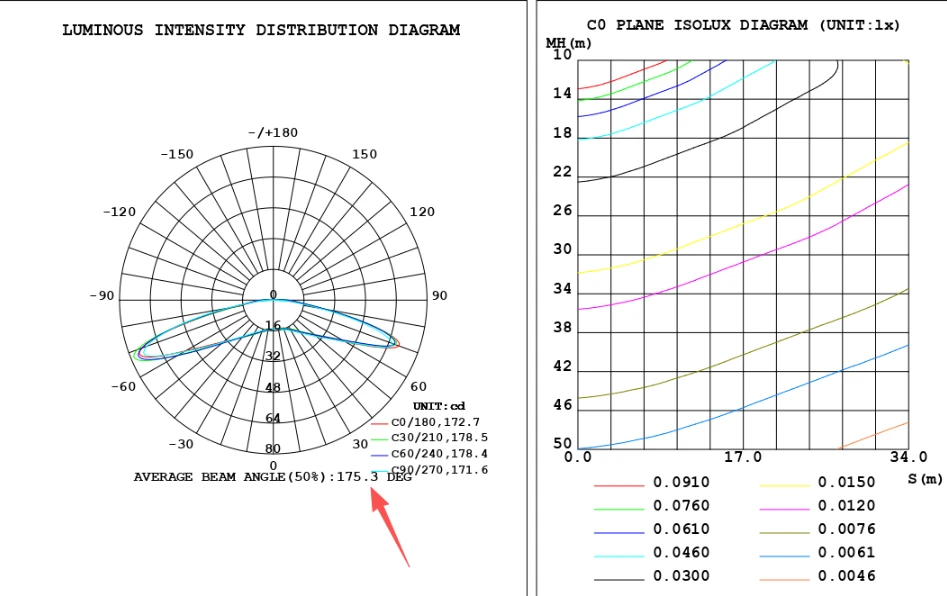
The LED photometric curve is the document that best explains how a module will behave before you fit it, and also the one most often left unread in the workshop. Behind those coloured lines lies the answer to how far apart you can space 12V LED modules with a 175° wide-angle lens for light boxes and signs without hot spots or shadows on the front face. In this guide we read, step by step, the real laboratory report shown above: the red arrow points to the average beam angle.

Module analysed in this report
High-intensity LED module 140 lm/W – 4 diodes – 175° – 1.8 W – 12 V DC – IP67
252 lumens per module and a 175° batwing lens to space modules further apart in shallow and medium-depth signs and light boxes, with no hot spots on the front face.
View datasheet, price and installation table →In 30 seconds
- · 1 polar diagram: direction of light (degrees) and intensity (candelas, cd).
- · 175.3° average beam angle at 50% of maximum intensity.
- · 4 measured planes (C0, C30, C60, C90) with only 6.9° difference: symmetrical emission.
- · Batwing curve: about 16 cd on axis versus about 70–78 cd towards 65°–70°.
- · The 10–50 m isolux is a software format; for light boxes, the installation table rules.
A photometric curve, or luminous intensity distribution diagram, shows how many candelas a light source emits in each direction. It is obtained in a laboratory with a goniophotometer and presented as a polar diagram together with data such as the 50% beam angle and, often, an isolux diagram. Knowing how to read it lets you choose the spacing between LED modules, predict uniformity on the diffuser and compare optics from different manufacturers using measured data instead of marketing claims.
1. How is a photometric curve obtained in the laboratory?
It all starts in a dark room with matt black walls, where the only light present is that of the module under test. The module is fixed to the arm of a goniophotometer, a motorised instrument that rotates it on two axes with an accuracy of tenths of a degree while a calibrated photometer, placed at a fixed distance, measures the luminous intensity at each position. In type C instruments, the most common for luminaires and LED modules, the path is organised into vertical planes (C0, C30, C60, C90…) and, within each plane, into gamma angles from 0° (straight in front of the module) to 180° (straight behind). Before measuring, the module is powered from a stabilised supply at its rated voltage, 12 V DC in this case, and left on until its temperature and luminous flux stabilise, because a freshly switched-on LED emits more light than one that has been running for half an hour. The measuring distance is chosen several times larger than the size of the source so that the inverse-square law holds, and the instrument software converts the readings into candelas, calculates the beam angle and exports the results in standard formats such as IES or EULUMDAT (LDT), which are then loaded into lighting design software such as DIALux or Relux. Test and data-presentation methods are described in standards such as IES LM-79 (testing of LED lighting products), CIE 121 (photometry and goniophotometry of luminaires) and EN 13032-1 (measurement and presentation of photometric data), and reference laboratories hold ISO/IEC 17025 accreditation, which verifies their technical competence and the traceability of their calibrations. That is why, when comparing reports from different suppliers, you should always ask which laboratory ran the test, with what equipment and under which standard.
2. What does the polar luminous intensity distribution diagram show?
The left-hand graph, titled Luminous Intensity Distribution Diagram, is the photometric curve itself. Read it like a clock seen side-on, with the module at the centre:
- Angles (0° to ±180°): 0°, at the bottom, is the front direction of the module; ±90° is the horizontal plane, level with the base; and ±180°, at the top, is the rear. The curve only occupies the lower half because the module emits no light backwards.
- Concentric circles (0, 16, 32, 48, 64 and 80): they are the intensity scale in candelas, marked UNIT: cd. The further from the centre the curve reaches at a given angle, the more light is emitted in that direction.
- Four coloured curves: each corresponds to a measurement plane (C0/180, C30/210, C60/240 and C90/270), as we will see in section 3.
Why is the curve shaped like a bat's wing (batwing)?
A conventional lens concentrates maximum light straight ahead (0°). Here the opposite happens: on the central axis the curve barely reaches the first circle, about 16 cd, and opens out towards the sides into two lobes whose peaks, between 65° and 70°, approach the outer circle: an approximate reading of the graph gives 70–78 cd, four to five times more than on axis. This silhouette is known as a batwing distribution.
The reason is geometric. Light leaving at an angle travels further to reach the diffuser and arrives obliquely, so it lights less per unit of area. By boosting lateral emission, the lens compensates for those losses: the area directly in front of the module is not over-lit and the space between two neighbouring modules receives more light. The result is a front face without hot spots using fewer modules per square metre.
What does “Average Beam Angle (50%): 175.3°” mean?
It is the figure the red arrow points to. The 50% beam angle (FWHM criterion, full width at half maximum) is the full opening between the two directions where intensity drops to half of its maximum value. With peaks of about 75 cd, the threshold is around 37 cd, and the curve does not fall below that value until it almost touches the horizontal plane. That is why the average opening reaches 175.3°: the module distributes useful light across practically the whole front hemisphere.
An important nuance: with a batwing lens, the beam angle alone does not describe uniformity. Two modules can both declare 175° and distribute light very differently. That is why you should always look at the shape of the photometric curve, not just the catalogue figure.
3. What are the C0, C30, C60 and C90 planes of a photometric curve?
The goniophotometer measures the distribution in several vertical slices rotated around the module axis. The diagram legend gives the 50% beam angle for each plane:
| C-plane | Beam angle (50%) |
|---|---|
| C0 / C180 | 172.7° |
| C30 / C210 | 178.5° |
| C60 / C240 | 178.4° |
| C90 / C270 | 171.6° |
| Average (Average Beam Angle) | 175.3° |
The average of the four values, (172.7 + 178.5 + 178.4 + 171.6) / 4, gives exactly the 175.3° shown below the graph. The difference between the widest and the narrowest plane is only 6.9°, and the four curves overlap almost completely: emission is practically symmetrical around the axis. In practice, the module behaves the same however you rotate it inside the box, which simplifies zigzag mounting.
Recommendation
The module in this report: 4 diodes, 252 lm and a 175° lens
High-intensity 140 lm/W LED module, 1.8 W, 12 V DC and IP67, with a spacing table by box depth and a calculator on the product page itself.
View the 140 lm/W 4-diode LED module4. How do you read the C0 plane isolux diagram?
The right-hand graph, C0 Plane Isolux Diagram, translates the intensity of the photometric curve into illuminance (lux) on a surface. Its axes are:
- MH (m), vertical axis: mounting height, from 10 to 50 metres.
- S (m), horizontal axis: lateral distance from the module's vertical, from 0 to 34 metres.
- Coloured curves: lines of equal illuminance, from 0.0910 lx (red) to 0.0046 lx (orange).
Such small figures do not indicate a fault: the lab software applies by default a scale designed for street lights and floodlights, and at 10–50 metres a 1.8 W module only produces fractions of a lux. What the isolux does provide is the shape of the curves: they rise towards the right, confirming that illuminance is maintained far from the axis, consistent with the batwing emission of the polar photometric curve.
How do you convert candelas to lux at light-box scale?
The relationship is the inverse-square law with angle correction: E = I(θ) · cos³θ / h², where E is the illuminance in lux, I(θ) the intensity in candelas in that direction and h the perpendicular distance to the diffuser in metres. With 16 cd on axis and a front face at 80 mm, a single module provides 16 / 0.08² ≈ 2,500 lx directly in front. Adding the light arriving obliquely from neighbouring modules, the result matches the order of magnitude of the 3,000–4,200 lx the manufacturer gives for that depth in the table below. It is a theoretical estimate: the diffuser, the colour of the box interior and reflections change the final value.
5. What does this photometric curve mean when fitting the module in a light box?
A 175° opening with batwing distribution allows the spacing between modules (Dm) to exceed the box depth (P). The manufacturer's installation table for the module in this report shows it clearly:
| Depth P (mm) | Spacing Dm (mm) | Dm / P ratio | Density (modules/m²) | Illuminance (lx) |
|---|---|---|---|---|
| 40 | 90 | 2.25 | 121 | 9,600–13,000 |
| 50 | 100 | 2.00 | 100 | 6,000–7,200 |
| 60 | 120 | 2.00 | 64 | 4,200–6,000 |
| 80 | 140 | 1.75 | 49 | 3,000–4,200 |
| 100 | 160 | 1.60 | 36 | 2,600–3,600 |
| 120 | 180 | 1.50 | 30 | 2,200–2,700 |
In shallow boxes the spacing reaches 2.25 times the depth (90 mm at 40 mm depth), and stays above 1.5 times even at 120 mm. That is the practical translation of the photometric curve: fewer modules per square metre, lower consumption and fewer connections for the same uniform front face. For your exact size, how many modules does your light box need? The LED module calculator by depth and dimensions works it out in seconds from the width, height and depth of your sign, with total consumption and the recommended power supply. Once you have the number of modules, check how to connect LED modules in series with a maximum of 20 per line so they all shine evenly.
Next step
Ready to take it to your project?
Our technical team helps you size the installation, choose the right power supply and quote the material in less than 24 h.
Frequently asked questions
What is an LED photometric curve?
It is a graph showing how much light an LED module or luminaire emits in each direction. It is drawn on a polar diagram: the angle gives the direction and the distance from the centre gives the luminous intensity in candelas (cd). It tells you whether the light is concentrated, uniform or pushed sideways before you install the product.
What does the 50% beam angle (Average Beam Angle) mean?
It is the full opening between the two directions where intensity falls to half of its maximum value (FWHM criterion). In the report analysed it is 175.3°, the average of the four measured planes. Such a high value means the module spreads light almost to the horizontal plane, so modules can be spaced further apart inside a light box.
Why is the intensity lower directly in front of the module?
Because the lens is a batwing type. It redirects light towards the sides: on the central axis the graph shows about 16 cd, while the peaks between 65° and 70° read at around 70–78 cd. This avoids a hot spot in front of the module and lights the area between neighbouring modules better.
What do the C0, C30, C60 and C90 planes in a photometric report show?
They are vertical slices of the light distribution rotated around the module axis. If the curves of all planes overlap, the emission is symmetrical and the module orientation inside the box hardly matters. In this report the beam angle only varies between 171.6° (C90) and 178.5° (C30), a difference of 6.9°.
Are the lux values in the isolux diagram useful for a light box?
Not directly. The lab software generates the isolux diagram for mounting heights of 10 to 50 m, intended for outdoor luminaires, which is why it shows fractions of a lux. In a light box 40 to 120 mm deep, what matters is the shape of the curves and the manufacturer's installation table, which gives the real illuminance on the diffuser.